This report is only available to advertisers on the Elevate Technology plan
This report visually demonstrates revenue driven from each area of the conversion funnel over time. Select the affiliate partner from the ‘Choose Affiliate’ box to review and see changes to the funnel performance over the selected timeframe.
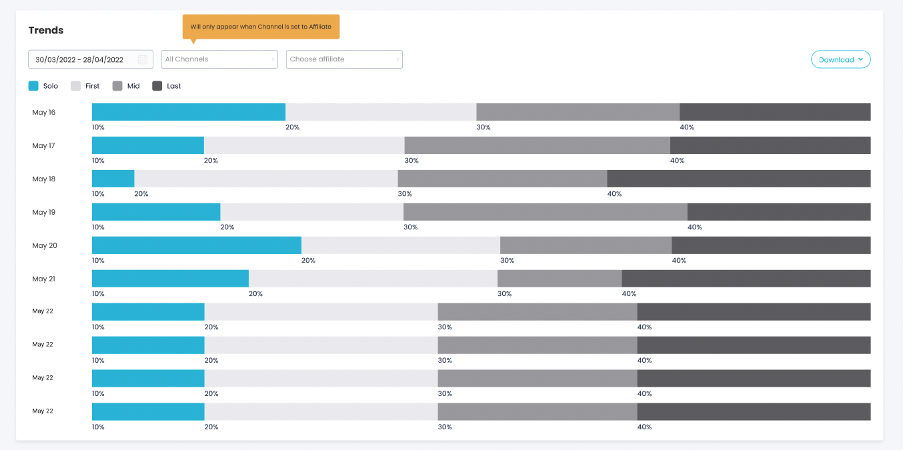
An Advertiser’s funnel is broken down into four levels:
Solo – A journey where this was the only touchpoint before conversion.
First – The first touchpoint in a multi-touchpoint journey.
Mid – Any touchpoint in a multi-touchpoint journey that isn’t the First or Last Click.
Last – The last touchpoint in a multi-touchpoint journey.
Hover your mouse over a segment of the report to drill further down into the data. Revenue refers to the total revenue attributed to the affiliate in each level of the funnel. Percentage refers to the frequency in which that affiliate appeared in each level of the funnel (the sum of all the percentages should equal 100%).
This report is ideal for reviewing the impact of activity with selected publishers over a specific time frame.
To learn more about how Commission Factory calculates and assigns value to all touchpoints in cross-channel attribution reporting, please click here.