This report is only available to advertisers on the Elevate Technology plan
This report visually demonstrates the areas of the conversion funnel publishers are driving revenue from on a per-affiliate basis.
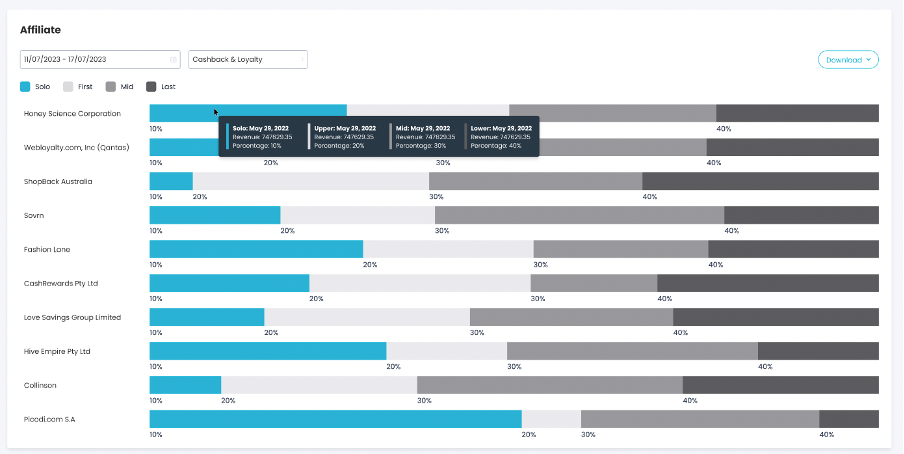
For the selected date range and affiliate type the graphic displays the breakdown across four categories:
Solo – A journey where this was the only touchpoint before conversion.
First – The first touchpoint in a multi-touchpoint journey.
Mid – Any touchpoint in a multi-touchpoint journey that isn’t the First or Last Click.
Last – The last touchpoint in a multi-touchpoint journey.
Hover your mouse over a segment of the report to drill further down into the data. Revenue refers to the total revenue attributed to the affiliate in each level of the funnel. Percentage refers to the frequency in which that affiliate appeared in each level of the funnel (the sum of all the percentages should equal 100%).
Marketers can see which affiliate partners operate in different parts of the conversion funnel beyond the last touch. It can help negate or validate assumptions on which part of the funnel an affiliate has the most influence. This can lead to more strategic partnership ventures with those affiliates who had a significant impact on the purchase decision.
To learn more about how Commission Factory calculates and assigns value to all touchpoints in cross-channel attribution reporting, please click here.